Data Wrangling 3: Group By, Mean, and Group By + Mean
You will do data wrangling for about 90% of your time. So, may as well get pretty good at it. Will be a nice time saver.
Table of Contents:
Introduction
Group By
Average (Mean)
Group By + Mean
1 - Introduction
Welcome back to another data Wrangling post. From this post, you already know that you will spend about 80 to 90% of your time on the wrangling the data. Last time, we spoke about how to create a new column, and give it values based on a certain criteria.
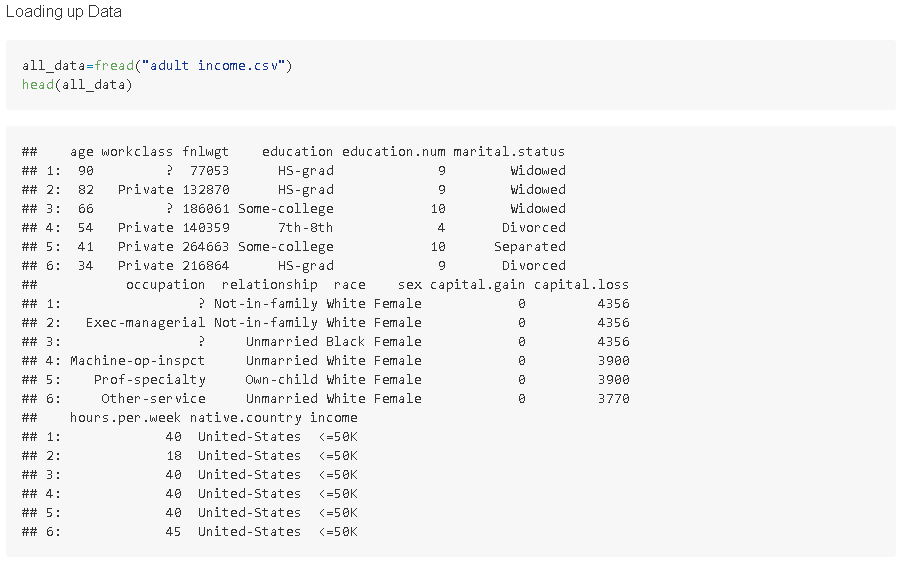
For this post, we’ll focus on how to use group by, mean, and then how to combine them together in a dataset. I’ll be using the adult income dataset. You can find it here. Here is a quick snapshot so you know what we’ll be looking at:
FYI: Nothing wrong with use excel to open up csvs. Whatever you do, DO NOT SAVE IT though. Sometimes if a value has several leading 0s, and if you save it, then those 0s are gone, and you won’t be able to do merges properly in the dataset.
For this scenario, we will be exploring what a person’s average capitalLoss was, given his hours per week worked.
In your Data Science/Analytics/Machine Learning Engineer/whatever the new buzzwords are, you will be doing aggregated calculations a lot, and you can easily swap out mean for median, mode, etc…
2 - Group By/Unique
Group by is a way of splitting your data into smaller, more manageable pieces. It allows you to see how different groups of data are related to each other.
For example, let's say you have a list of people's ages and their favorite colors. You can use group by to split the data up so that you can see how age and color are related. This can be really helpful for doing things like analysis and graphing.
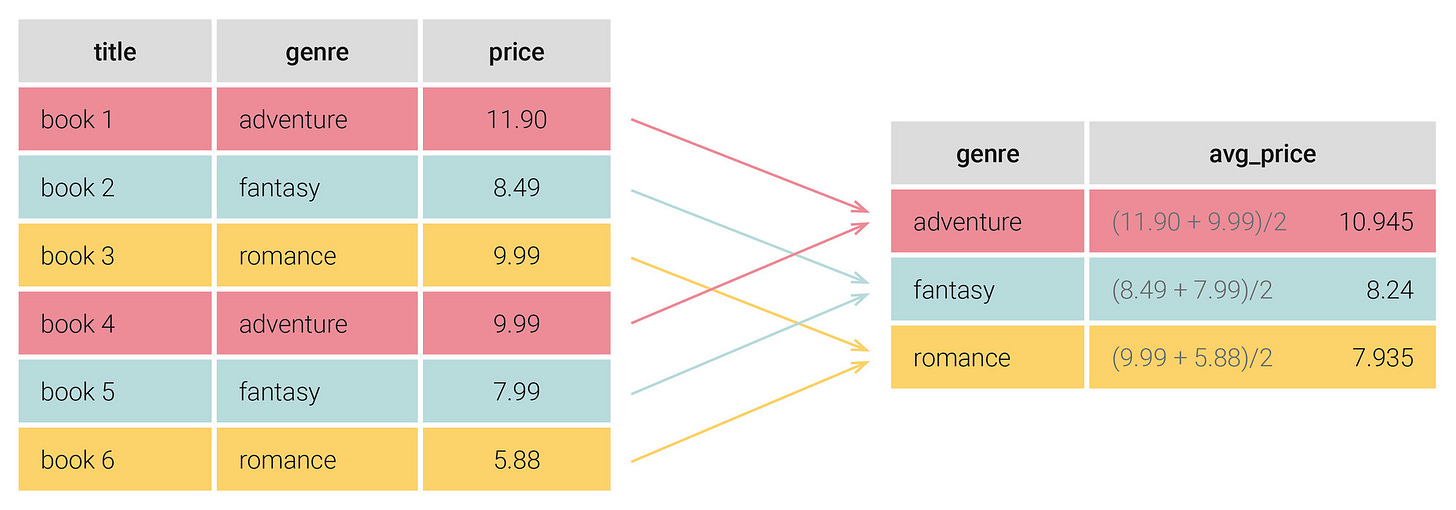
Here is a simple visualization of group by:
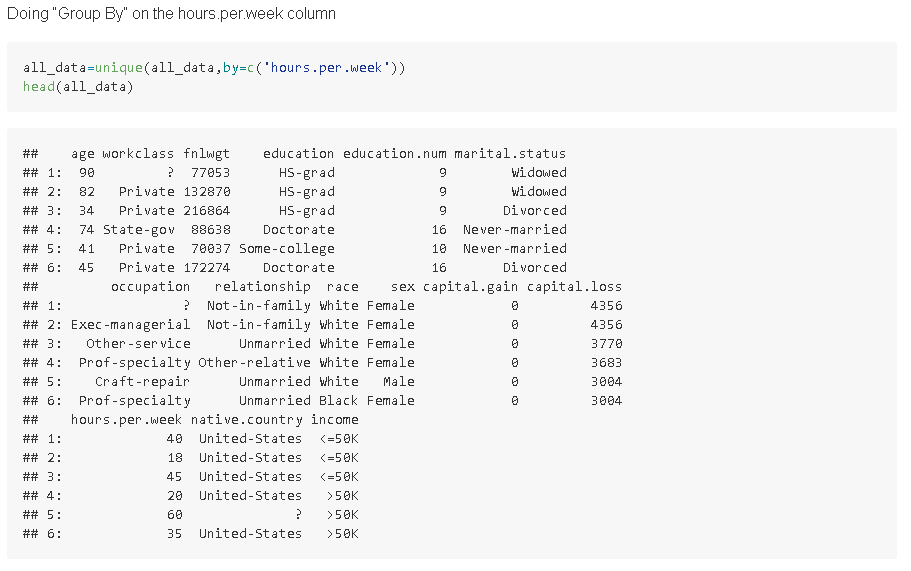
In the examples below, we will group by, so that we only have unique entries for hours per week worked.
Python
We’ll load up the data in Python as normal, and then we can use the .drop_duplicates() function. All we have to do is point the specific column we are after, and we are done.
R
As usual, when working with dataframes in R, you will want to use the data.table library. The big tldr is because it can do everything default dataframes can do, but better in every single way.
Once the data is loaded, we will use the unique( ) function on our dataframe, and just tell it which column to look at.
SQL
To do some sql practice, I like to use a tool called https://sqliteonline.com/. Very handy. To do the group by unique stuff in sql, we will use the group by clause.
I was not able to load up the entire dataset of 4MB here, so I took a small chunk of it instead to run the SQL practice.
In this case, it has also gone ahead, and also ordered by hours.per.week as well.
3 - Average (Mean)
The average is a measure of the "central tendency" of a dataset. This means that it gives us an idea of what the typical value in the dataset is. This can be useful for understanding the distribution of data and for identifying outliers. Additionally, when used in conjunction with other measures such as standard deviation, the average can help us to identify how spread out or clustered data is.
Again, mean is just a simple placeholder for this example, you can swap it out for any other calculation of your preference
Python
In Python, to do this, all we have to do is use np.mean( ) and then specify the column we are after into the dataset.
R
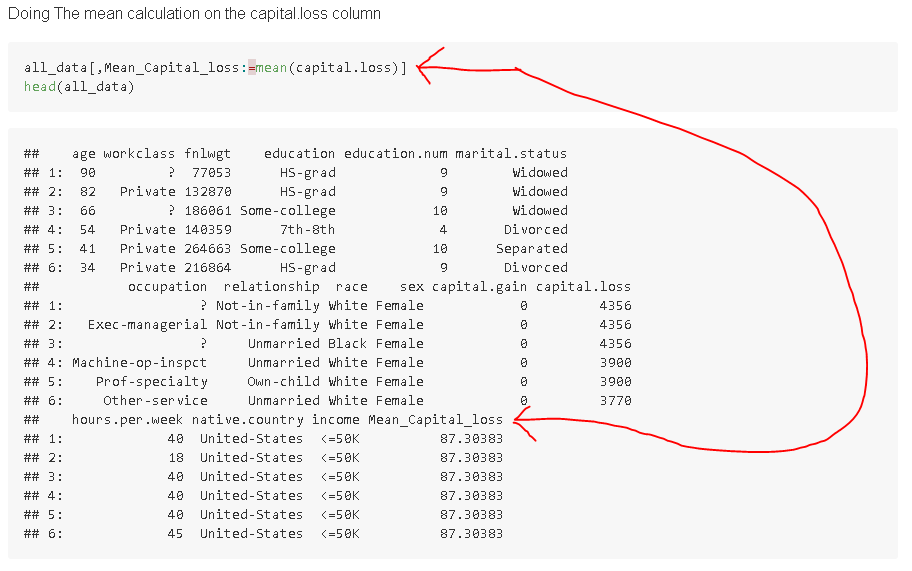
when working with data.tables, we will use the := symbol when making a new column, then just specify the column names, and the calculation you would like to apply.
SQL
In order to get the mean of a column in SQL, simply use the AVG( ) function on the column of your choice.
4 - Group By and Mean Together
One thing you’ll notice is that getting the mean by itself is kind of useless most of the time, it will be better if it was used in conjunction with group by instead. In this example, we’ll combine group by and mean together.
Python
In Python, we will first specify the column that we want the mean function applied to. Then, we will specify what we will use to do the grouping, and then lastly we will specify the function in question itself.
Below is a new column called GroupBy hours.per.week and Mean_Capital.loss that tells us what the average capital loss was, based off their rough hours worked per week.
R
In order to accomplish this in R, we will use another argument called by= c( ). Just put the relevant columns that you want to apply group by to in there and you are finished.
SQL
In order to do the group by, and mean together in SQL, simply use the GROUP BY clause, with the AVG( ) function, and you are done.


