
Feature Engineering Part 2: Polynomial (Quadratic) Regression
In this post, we will be continuing on with what we learned from the feature engineering part 1, but this time on Quadratic & Trinomial Regression. Squeezing even more value out of your data

Back in action after the soar throat.
Required Readings
Where You Would Use This
Remember, the concept of Feature Engineering is the idea that there are certain tweaks you can perform on your current existing data, in order to squeeze more value out of it. In Part 1, we talked about how we can create some simple dummy variables that basically act like categorical data in order to squeeze more value out of our data. In Part 2, we will talk about another concept for Feature Engineering called Polynomial (Quadratic) Regression.
Let’s say you want to model data. Linear Regression assumes that you your data is sufficient enough in order to essentially create a hyperplane of best fit in order to model this equation below.

But, what if it is not good enough? What if instead our equations was quadratic? Something like this equation below? Then what would we do?

Long story short, you can see that the straight line will not work here, we will have to do something else.
Hint: The answer for modelling Quadratic data is to use quadratic regression. In order to solve this problem, we will use a generic regression technique called Polynomial Regression.
Interview Tip: If you are going for an interview soon for some sort of a technical position, You can click here to see how the Multiple Linear Regression model works.
On the Job Tip: If you are already working in a Data Science, or a Machine Learning role, try to run the polynomial regression technique we are discussing in this post. You’ll be surprised to see just how few people know about it…
The original Model & Data
You can go here to see the original model that we used, alongside the data points. A quick recap is we were given some numerical data, and some categorical data, and we were supposed to use that said data in order to predict what the age of the possum is. Since age cannot be a decimal, we must round the number at the end. Below is the results of just doing a simple linear regression, and then the improvements, when we create some categorical columns (dummy variables) based off the data.
The old model
Remember, the dependent variables (x-axis) were all of the factors that were about the opossum, and the independent variable (y-axis) was it’s age. Age is required to be a whole number, and it cannot be a decimal.
The binary columns technique

Feature Engineering Part 2: Polynomial (Quadratic) Regression
Linear Regression is great, when we are assuming the connection between our data, and the target y we are trying to predict is a linear connection. That is, for every +1 increase in one of our column values should result in a +whatever number on the target y values. However, what if instead of being a linear connection, what if it was quadratic instead? In this case, linear regression would fail us pretty quickly.
Note: When you tweak the data to make it quadratic, and then run a regression analysis on it, that is sometimes referred to as Quadratic Regression. Polynomial Regression is considered a non linear regression.

Typically, Polynomial Regression is generally meant to be used for 1 x-column, which you then put into matrix form, and tweak to end up with the matrix equation below.

However, in a real life case scenario, what people typically do is to take some of the current existing columns, and then raise them to the power of 2/3/4/…. and then add them in as extra columns.
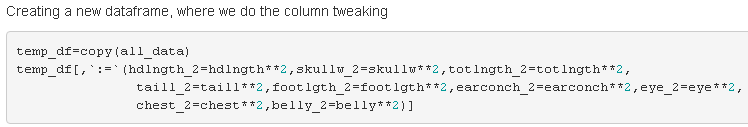
Let’s take the original numerical columns, and then square them, and then bring them back in, and observe the performance increase.
Note: The Normal Distribution assumption for linear regression still applies here. Click here to learn more about distributions.
GitHub Note: If you are interested in following along, and want to see the raw code used to run this. Click here
R
Quick observation of the data

Creating a new dataframe, where we will do the column tweaks
Perform and Observe the results of normal regression

Run Quadratic Regression, and look at overall performance increase
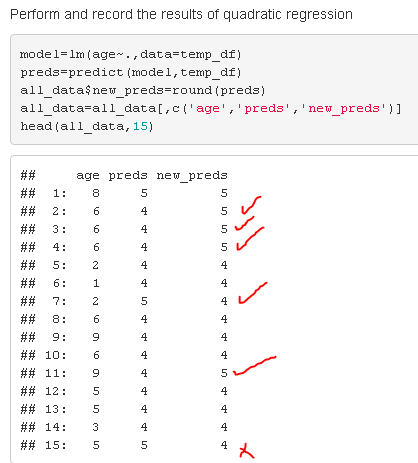
So, overall using Quadratic Regression brought us much more good than harm.
Python
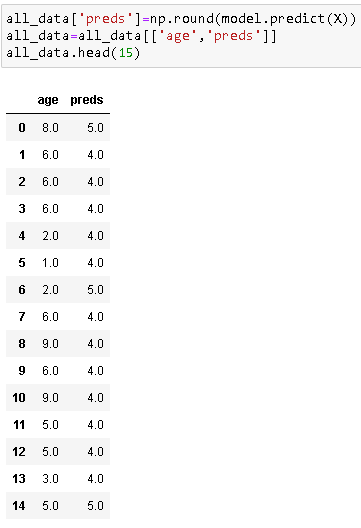
Quick Observation of the Data

Creating a new dataframe for column tweaks

Perform and Observe the results of normal regression

Run Quadratic Regression, and look at overall performance increase
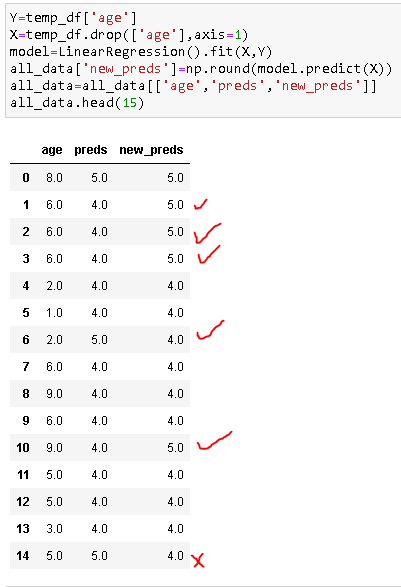
So, overall using Quadratic Regression brought us much more good than harm.
Finishing Thoughts
From the above you can see that running Polynomial Regression also generally tends to be a benefit as well. So, the question you are now probably wondering… at what point do you stop creating extra columns?
Why would we not continue squaring, cubing, raising the the power of 4, etc… and keep on going on forever?
The answer is because this causes a model to overfit. We’ll talk about how to analyze the quality of a model.