


Look-ahead Bias & How To Prevent It's Damage
Useful for Time Series Analysis, and time sensitive data.

Table of Contents:
Introduction
Lookahead Bias
Where you Might Encounter This Thing
The problems it can cause
Fixing This Headache
1 - Introduction
If you work extremely heavily with things like time series data, then you have to be prudent to make sure that when you are running the model, that your model has no way of “cheating”. By cheating, I mean we have to make sure that when the model is doing it’s analysis, it is only allowed to study the data that it would have been allowed to see at that point, and nothing from the future is allowed to go into the dataset.
For example take a look at the BTC price below:

Today, you know BTC was an excellent buy in 2019, so if you were to create some sort of a crypto model, the odds are you would have a little bit of a bias to try to make it not miss ‘the next big thing’, so you’ll end up tweaking it a bit by complete accident in favor of conditions that BTC was going through in 2019. This is an example of accidentally injecting in some Lookahead Bias. Let’s dig into this a bit deeper.
DS encounter Lookahead Bias constantly in the industry, hence why we sometimes look for people from unorthodox background and hire them as a simple sanity check, and to confirm our own analysis was indeed correct & not cherry picked.
2 - Lookahead Bias
For this post, we will focus on a topic called Lookahead Bias. Here is a simple image that explains the concept:

The basic idea is your model/analysis is relying upon information that was not yet available at that specific time. In other words if we were the run the model today (the year 2022), your model required information that was not even created until the year 2023. In other words, your model basically “cheated” by using information from the future (look-ahead).
3 - Where you Might Encounter This Thing
If you are working with any time series data, you must make sure that you don’t just chuck in a simple value like an aggregated mean or median. You must make sure you create some sort of a new column that is also sensitive to what date you are looking at.
Here is a simple example of several different types of patterns you will encounter with time series:
For example, a common way that most people incorporate macro economic data into their analysis is by going to a website called the Federal Reserve Economic Database (FRED). Then, they just simply download a csv dump of the graph that they see, and they just merge this into their analysis.
The problem is that the quality of the past data is constantly being upgraded by the government doing re-statements. Re-statements aren’t a bad thing overall, as generally the more times the data has been looked over, the better quality it should have.
To deal with the issue of keeping the data clean, and usable most DS already have their own APIs ready to go to pull data from FRED without any re-statements, in other words they see the data the way it was available back in the past.

You can try out the above tool from my site:
4 - The problems it can cause

Notice in the above picture, the blue line (has look ahead bias) outperforms both the S&P 500 and the Point in time (PIT) model. However, once both of the models were given sufficient time to run, and perform their strategies, by the end in Sep 2009, we can visually see there is not much difference between them.
Click here to see the full Refinitiv brochure.
When we have a huge promise in the analysis, but a huge disappointment when deployed, this is a perfect example of being hit with the lookahead bias. The model using the Non_PIT data was hardcoded, and was given some information on what the world would be like between Sep 2000 and May 2003. However, once it was put on even grounds, it really didn’t deliver much on it’s promise.
5 - Fixing This Headache
Feature Engineering
Typically, I’d recommend doing something like either a rolling, or a cumulative mean. Regarding normalization of your data, what you can do is apply something like a min_max scaler from sklearn.
 works? - Stack Overflow")
The difference of course is that instead of just finding the min/max for your column, you would want to create something like a cumulative/rolling min and max. and then use that instead.
So, the new formula would become something like this:
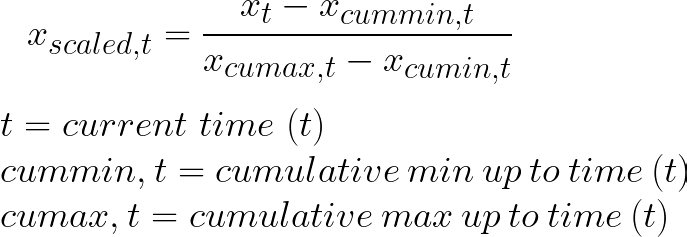
I like using the min max scaler as it’s extremely good at capturing the overall troughs and peaks in the world of finance, and normalizing the data while also keeping the look-ahead bias away is a great thing.🦖
Analysis of your ML model
Regarding the analysis of your ML model, you can do something like an expanding window, or a rolling window:
Rolling Window
The idea is you will pick something like a simple time frame, could be something like the past 1 year. You will then use this, and only thing to predict something like 1 month forward. Then you will merely roll the past and the future… forward by 1 month over and over again.
Here is a rolling window visualized:

Expanding Window
The concept of the expanding window is that you will retain all of the past data, and you will predict forward something like 1 month, or maybe a 1 year. Then you will add the actualized data into your training results, and further expand the window out maybe 1 month, or maybe a year. Rinse and repeat.
Here is an expanding window visualized:

Conclusion
Regardless of which of the above windows you pick, you must ensure you keep a small chunk of data separate until you are finally satisfied with your model. Once you are, you should try to predict upon this test data, and see what you come up with.
The main reason why we do this is because we want to keep how we are tuning our model away from the finalized un-touched dataset, and then see how well our model performs on this. In other words, by keeping an untouched dataset away from our model, we would once again prevent any accidental lookahead bias from being injected into our model.
Hopefully, this post helps you guys out with your time series analysis. Cheers.