
Power BI 4: Power Query Basics
Navigating Power Query, Navigation Ribbon, Query Information Panel, Applied Steps

Thanks to BowTied_Analyst for helping write this one.
This post is going to go over the basics of Power Query. Power Query allows you to transform a data source into the form and the format that meets your needs. In this context transform is a synonym for shaping and I will use the two interchangeably. You should also keep in mind how this part of the process is like the data munging/data cleaning process. This is what Data Scientists or Machine Learning Engineers do. Power Query is a low/no-code alternative to the data cleaning process.
Power Query available in Excel and Power BI. It is important to note, the underlying data that Power BI is connected to is not changed. Power Query just modifies its view of that data.
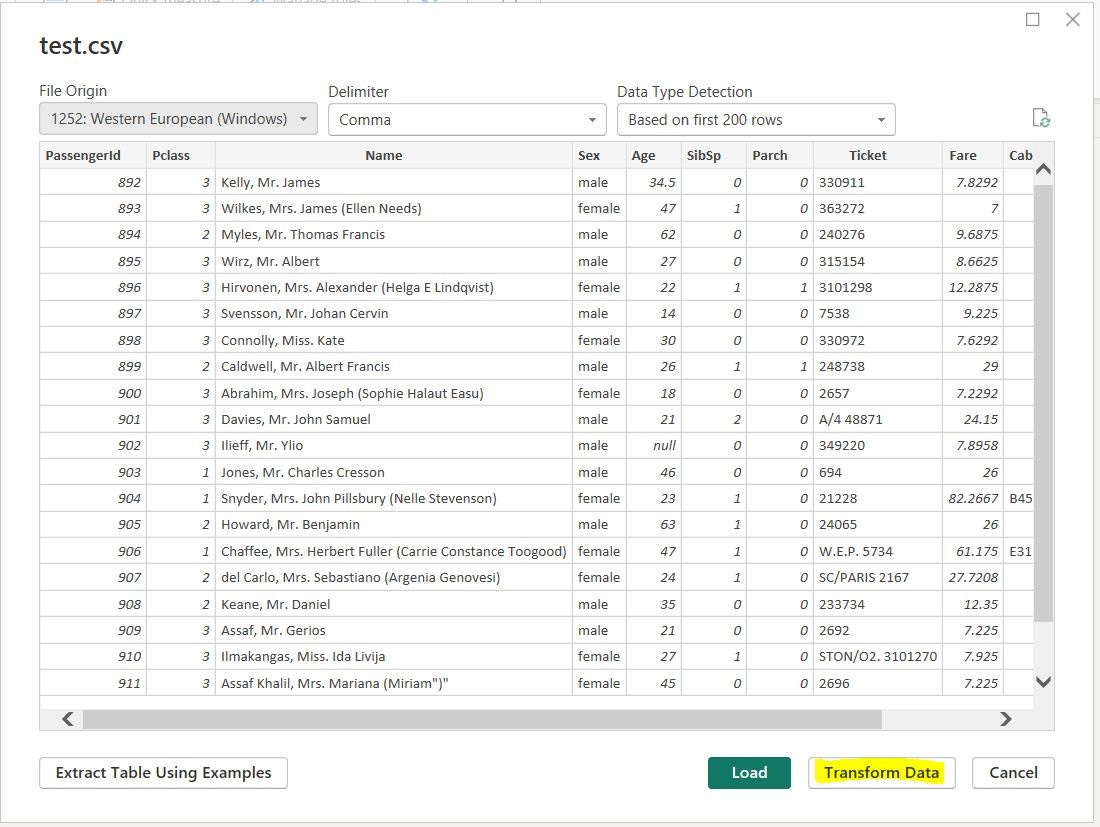
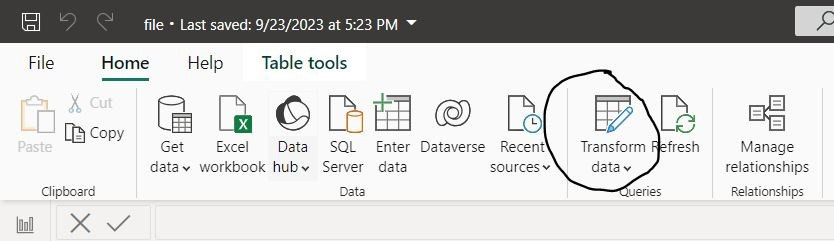
You can access Power Query directly when connecting a data source to Power BI (above). You can also do it later after a data source has been added through the "transform data" button on the navigation ribbon (below). Clicking this button launches Power Query.
Navigating Power Query
Your Power Query “home page” contains several parts:
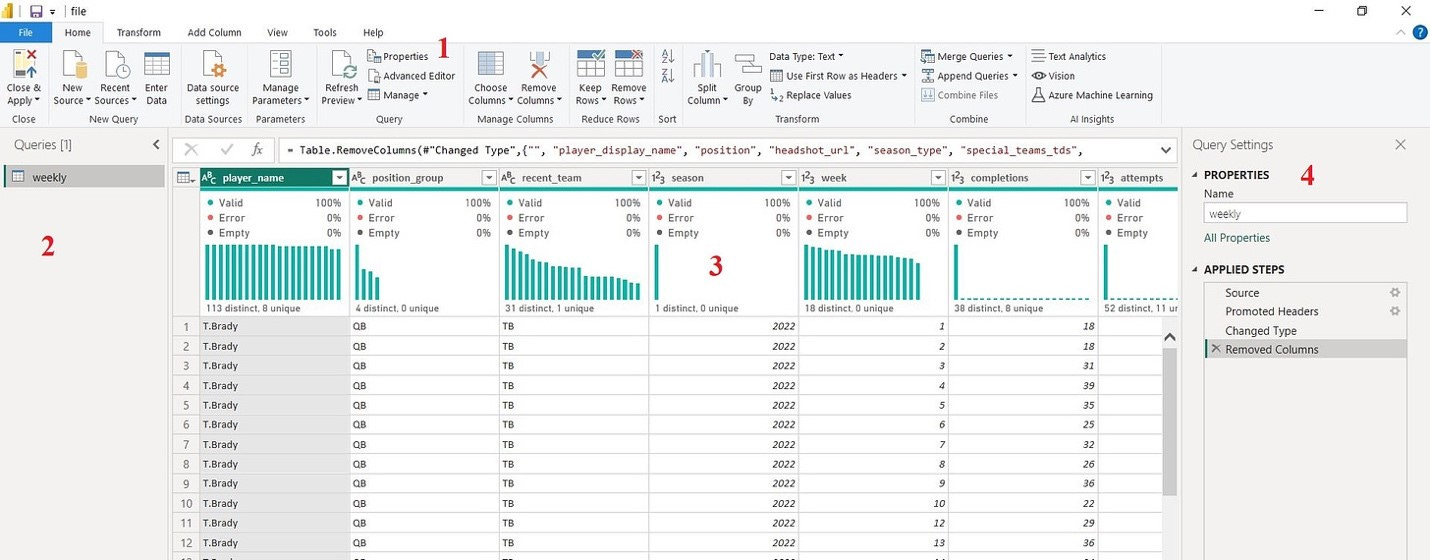
Navigating Ribbon
Query Tab
Data
Applied Steps
The Power Query Navigation Ribbon
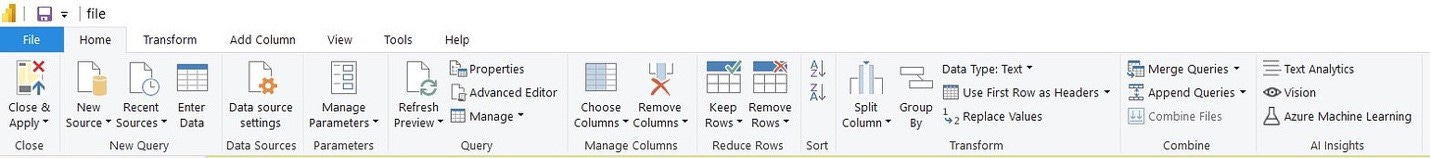
Once launched, the top of the screen is a navigation ribbon with several tabs for further navigation and frequently used transformation options. These buttons provide options for cleaning or shaping or transforming your data that are comparable to a lot of the general python or pandas functions.
Query Information Panel
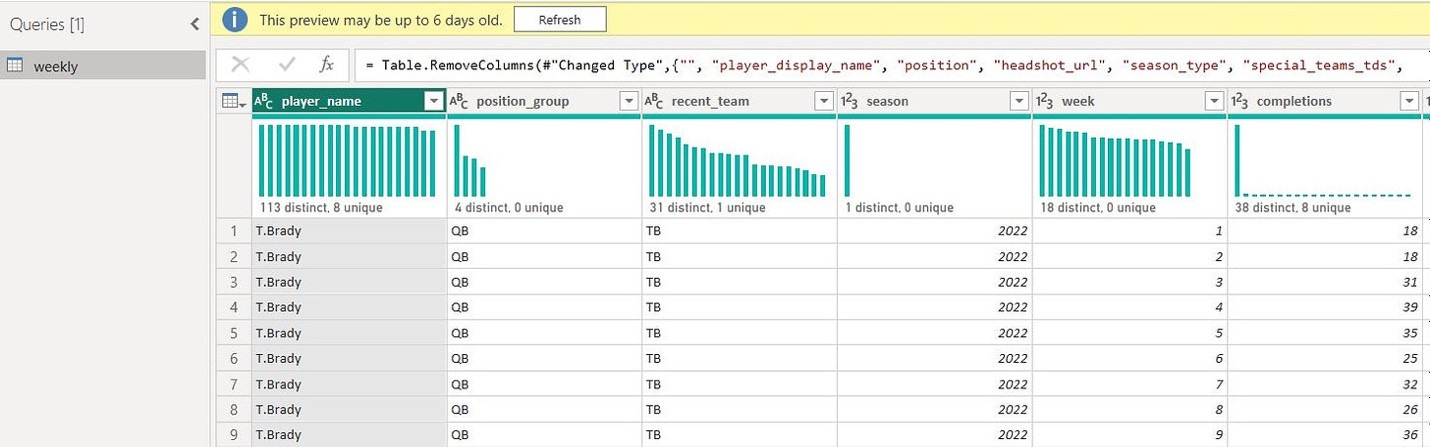
Power Query has an info panel on the left that contains all of the queries (individual data connections). The queries are the data sources or custom tables created by the user. For more information on how to connect to data sources, see **previous post**. Selecting a query will show the data contained in the query in your data pane. Each query will also have one or more steps that changes the shape of the data.
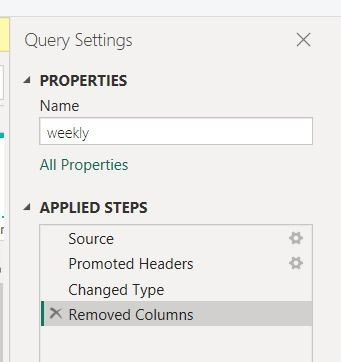
Power Query Applied Steps
On the right you have a list of "applied steps" for each query meaning what are the steps you have selected to transform/shape the data. At a minimum, the applied steps will contain directives on how to find your data source. If your data source locations, you can change the source to avoid re-doing your data transformation processes. As more changes are applied to the data, the steps appear in the applied steps pane. The underlying data that Power BI is connected to is not changed. Power Query just modifies your view of that data.
As a Power BI user, you can insert steps, delete steps or rearrange steps in the applied steps window. When a Power BI Dashboard/Report breaks because of data source modifications, the applied steps of Power Query are the first place I go to trouble shoot. Usually, the formatting of the underlying source changed which causes one or more steps to break. For example, a column that needs its data type or name changed has a different name than the one specified in Power Query.
The order in which you transform your data is both unimportant in that so long as your transformations give you usable data, you’re fine. However, removing extra un-needed data saves your computations load. This can matter especially with large data sets. Ideally you have filtered un-needed columns out while connecting Power BI to the data source, but that’s not always possible.
Frequently Used Power Query Transformations
I'm going to highlight some important Power Query functions, describe what they do and compare them to frequently used Python functions. There are three tabs holding transformation functions on the Power Query Navigation Ribbon including:
Home
Transform
Add Column
Each of these tabs has important Power Query transformation functions. I’m going to go through my most frequently used functions now. Some of the functions are available in more than one tab. A lot of the simpler functions can also be activated by right-clicking on the column that you want to perform them on.
Home Tab Row/Column Transformations
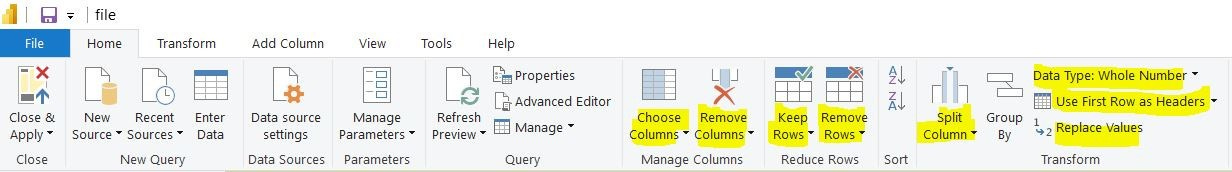
Managing columns: includes the selecting columns to keep or discard. Compare to the .loc or .iloc function in Python.
Reducing Rows: Reducing rows includes selecting rows to keep or discard. Again, compare to .loc or .iloc functions in Python.
Split Columns: Allows you to split based on many different things like a specific delimiter, number of characters, position or change in character types. Compare to the .split() function in python.
Use first row as headers: Flat files can have irregular formatting. This function is typically used along with the elimination of black rows at the top of a data table to set the column names in Power Query when formatting is strange.
Change Column Title: Another function that can be used wither by access on the ribbon or by clicking on the title of a column and typing in a new name. Compare to the .rename() function in Python.
Replace Values: Allows you to replace a specific value/values with another of your choosing for the selected column. Compare to the .replace() function in Python.
Change Data Types: Each column has a specific data type. The data type becomes VERY important as you build a data model and create visualizations. You can toggle the data type either through the ribbon or by clicking the icon in the top right of a column. Compare to .astype() in Python.
Important Functions in the Transform Tab
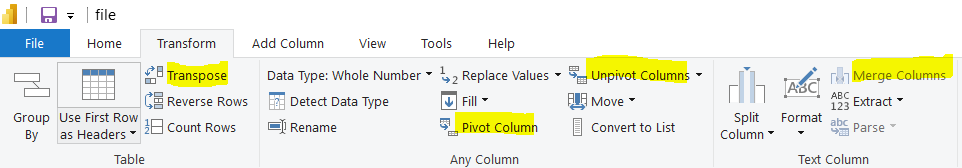
Merge/Append Queries: combine queries/data sets into one. Merge combines multiple queries on a column and append combines two together, one on top of the other. You can compare the Merge function to .merge() or .join() in Python and Append to the .concat() function.
Transpose: This transposes the rows and column in Power Query. Compare to .transpose() in Python.
Pivot/Unpivot: Pivoting allows you to change the shape of your data table. Either increasing the length while decreasing the columns or increasing the columns while decreasing the length. Compare to .stack() and .melt() functions in Python.
Add Column Tab Functions
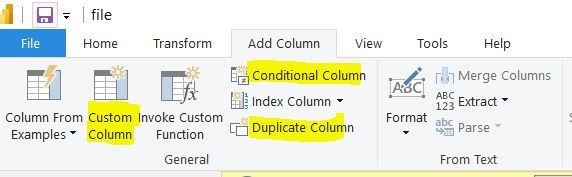
Adding columns with Python/R can require complex logic and code structure. It’s easier in Power BI using the following functions:
Duplicate Column: Duplicates the column.
Conditional Column: Creates a new column with values based on one or more conditions in other columns.
Custom Column: Similar but more complex and flexible than conditional column. Creates a custom column using DAX instead of simple if/else statements.
Housekeeping Tabs in Power Query
There are also three tabs for housekeeping functions. They are:
View
Tools
Help
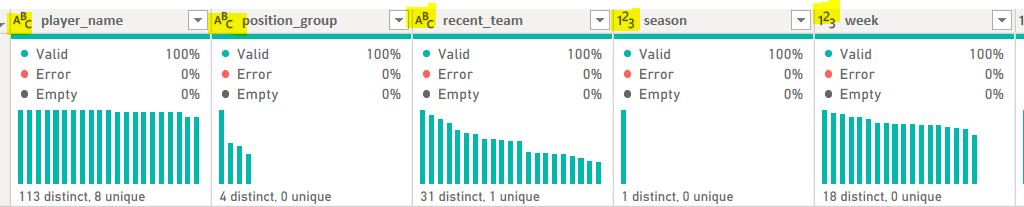
Help has links out to resources if you are ever stuck. I never use help because I use google not because I don’t get stuck. Tools allows you to run diagnostics on your report, again not something I often use. View allows you to toggle your data view. This is useful, with large unfamiliar data sets.
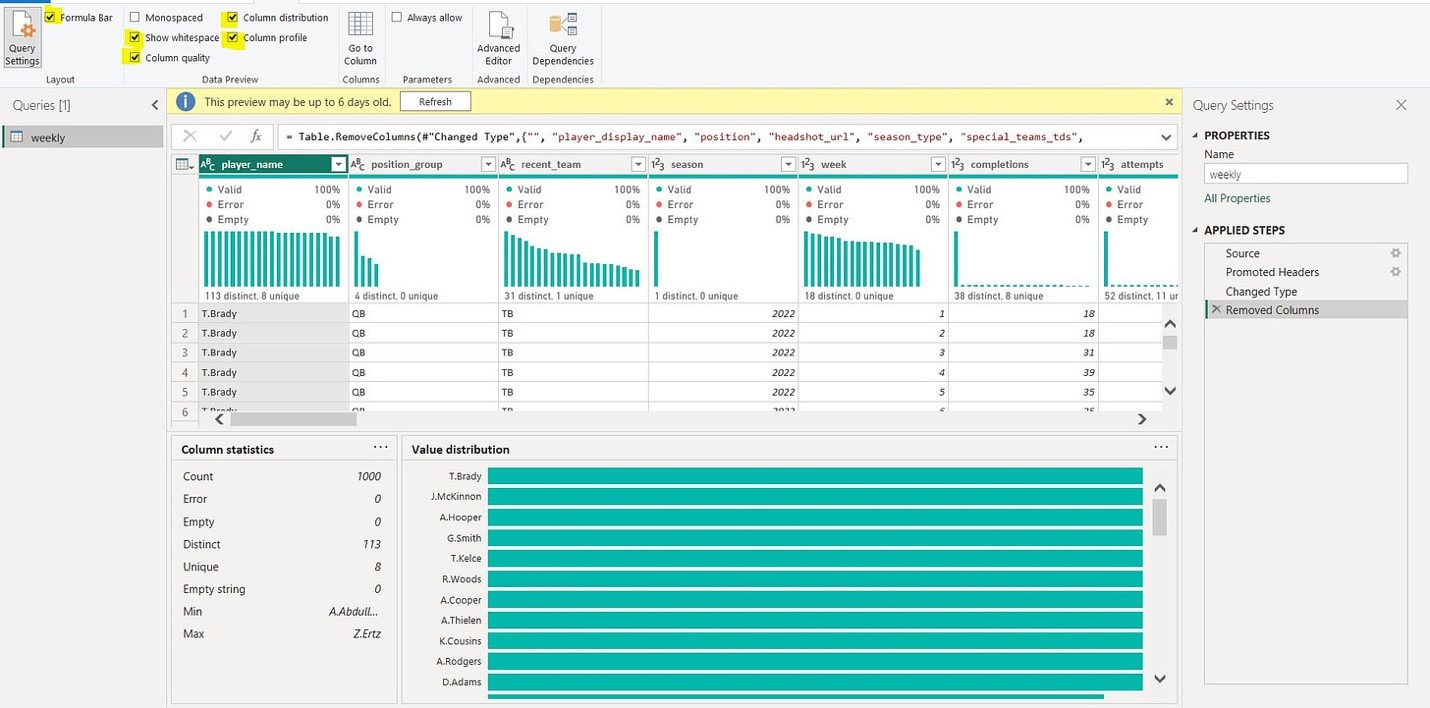
You can toggle things like column distribution, column profile, and column quality to give an overview of different aspects of your data. This can give you clues as to why errors are occurring in your visualizations and what transformations need to be done to fix these errors.
Advanced Editor & M-Code
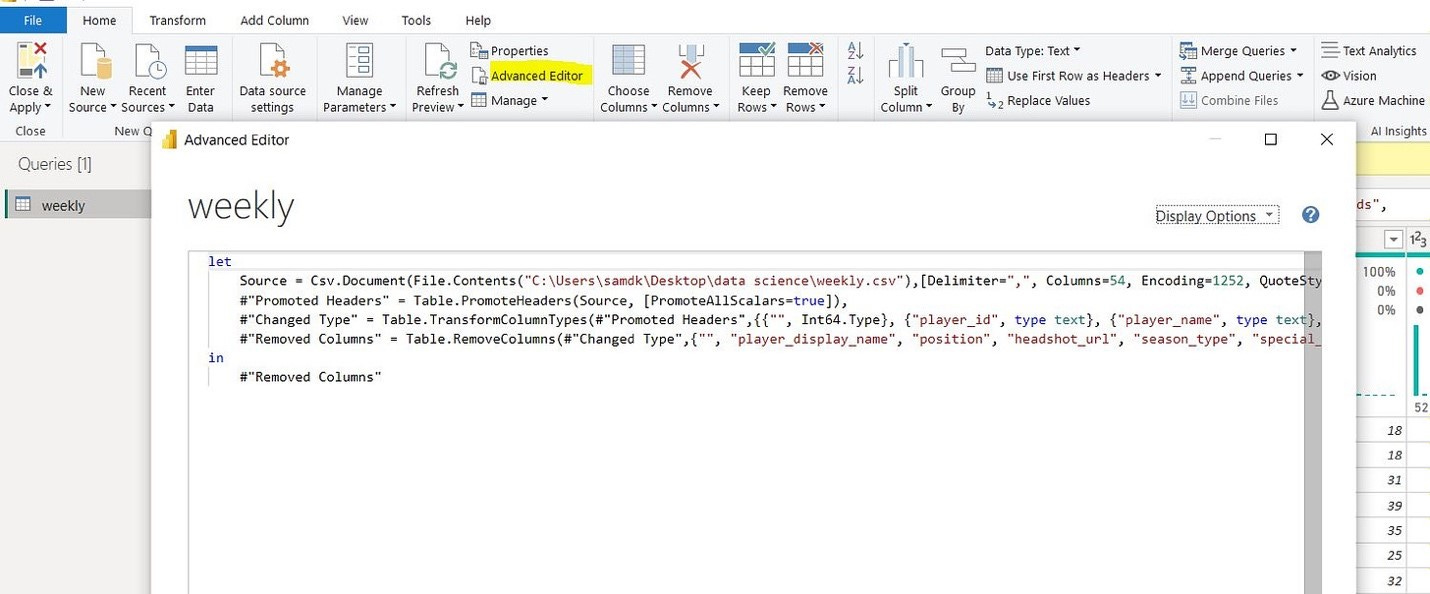
At the top of your page there is a button to click on that reads advanced editor. This button allows you to see the “M-code” that your queries generate. M is the language used to data transformation in Power Query. Each step in the code transforms data in a specific way, your final result being a structured table that is easily loaded into Power BI. M-code allows you to easily being a complex transformation process into other files. You can dig as deep into M as you want, I always use the Power Query GUI to build my transformations. I have copied M code a couple of times to bring transformation processes from one query to another.
Conclusion
This is a lot to take in. You can maximize your time by understanding the layout of Power Query and basic transformation functions while googling and/or accessing Microsoft documentation as you need to. I encourage you now to fire up your copy of Power BI desktop, add some dirty data, and attempt to do some basic transformations to get your data into a usable data format.