
Power BI 5: DAX Tutorial
DAX Measure, Setting up PowerBI for DAX Development, Calculated Columns, Calculated Tables

Thanks to BowTied_Analyst for helping write this post.
This post is a DAX Tutorial. DAX is short for “data analysis expressions.” It is a scripting language used in Power BI to make additions or changes on top of your basic data model and data tables.

DAX can be used in three ways:
Measures
Calculated Columns
Calculated Tables
Regardless of how DAX is being used, the structure of a DAX expression is as follows:
name = expression
Where name is the name of your measure/calculated column/calculated table and expression is your DAX.
What is a DAX Measure?
A measure is a DAX expression whose calculation is built on top of your existing data model. Measures are dynamic and context dependent. This means that it is important that your data model is finalized before you jump into building out DAX measures. The context of a DAX expression can also be changed with slicers or selections in another visual.
A measure can be as simple as an aggregation of a specific column filtered in a specific way or as complex as a context-dependent multi-variable formula used that flags aggregations when specific conditions are met.
A measure is a formula applied to an entire column or columns. DAX filtering functions can narrow down the scope of a measure, but when the calculation of a measure is initiated, it applies to the entire column/table. Measures are dynamic. They are taken into context the entire report, including filters, slicers and other conditions. They respond to changes in the report’s context aka filters and slicers.
Measures are not stored in the data model. They are calculated on the fly on top of the data model. Measures are best used when aggregation and dynamic calculations are needed.
Simple DAX Measure
A measure can be as simple as an aggregation of a specific column filtered in a specific way. The following measure aggregates the “salary” column of the “job” table. To create the measure, right click on the columns on the side and click new measure.
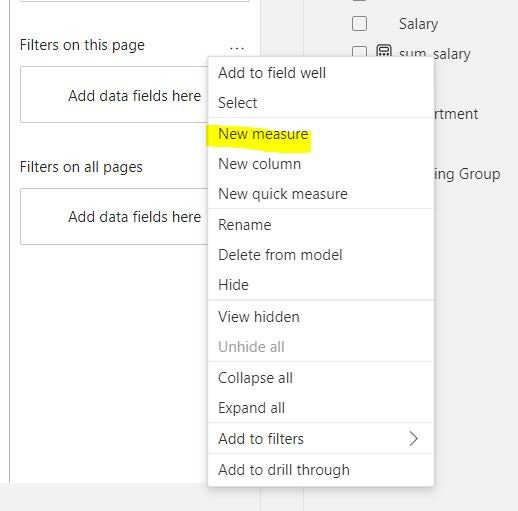
Now you can enter in the DAX measure.
sum_salary = SUM(Job[Salary])
“Sum_salary” is the name of the expression, SUM(Job[Salary]) is the expression. This expression applies the “SUM” function which is applied to the “salary” column of the “Job” table. I would recommend that you attempt to make a simple DAX measure like this one right now. Mostly because even with a simple DAX measure a couple of things can go wrong.
Setting Up Power BI for DAX Development
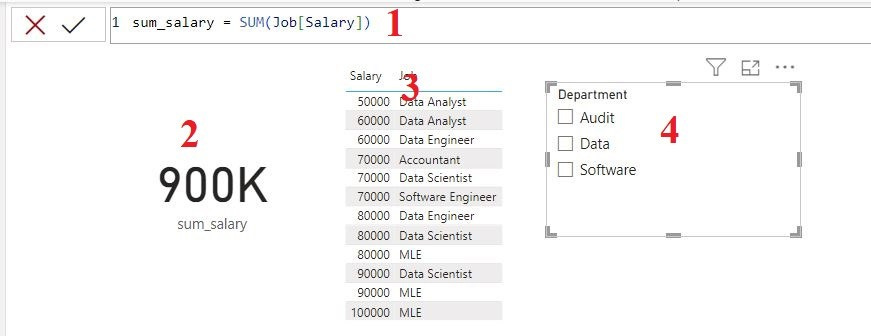
I have a very basic setup here using the same data set that I used in *link* building a data model. This is a very aesthetically unpleasing report page that is useful purely for development purposes of the underlying table/DAX. The parts of this are as follows:
The DAX Measure
Card Visual with DAX measure displayed
Table Visual with populated with data table and slicer.
Slicer Visual populated with “Department” column of “Reporting” table
You can see that everything is functioning correctly here. Sum_salary accurately calculated the sum of all the salaries in the job table. Now I’m going to break the measure to show you a common mistake that wrecks DAX calculations.
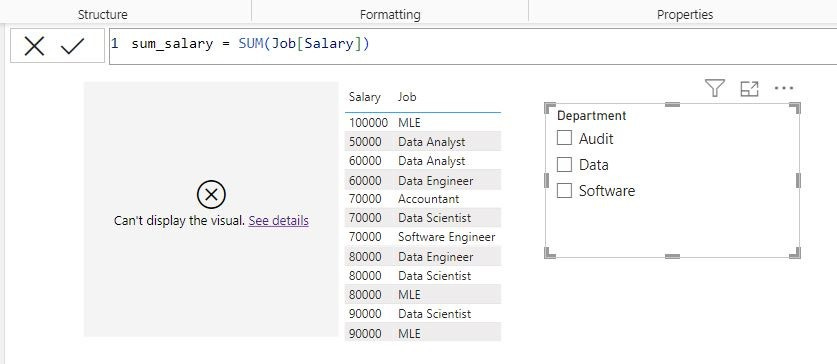
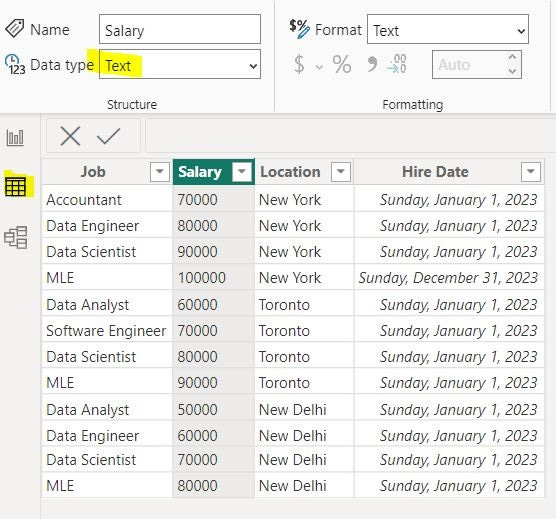
What happened to this simple DAX measure? This measure is broken now because the Data Type of the salary column is “text” rather than one of the numerics (whole, decimal or fixed decimal). You can adjust the data type in Power Query or in the table view tab of Power BI.
What is a Calculated Column?
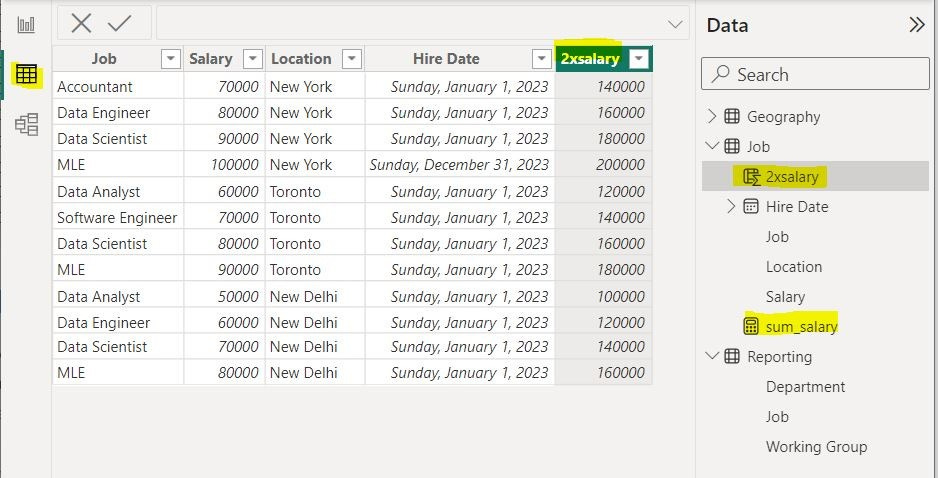
A calculated column is a static, row level calculation stored in a table compared to the dynamic context dependent calculation of a measure. Fundamentally, a calculated column is part of a table in the data model compared to a measure. This is calculated on top of the data model. A calculated column is calculated row by row rather than on top of the entire column. I’m going to create a calculated column that doubles the salary for each row:
2xsalary = Job[Salary]*2
2xsalary is the name of the calculated column, the DAX expression is the number contained in the salary column of the job table multiplied by 2.
DAX is used to create both the calculated column and the measure. While DAX is used to create both there are a few key differences both in display and how they work. You can click on the table view to dig into these differences.
5. The icon is different, a measure has a calculator icon and a calculated column has column with a sigma over it.
6. A calculated column is calculated row-by-row for its data table and added to the data table/data model. Notice how 2xsalary has its own column in the table while sum_salary does not.
7. A measure is calculated over the entirety of the table/column, rather than row by row. Filtering the column either inside the DAX calculation OR with a slicer will change the result of the measure.
What is a Calculated Table
A calculated table takes the logic of a calculated column and applies it to an entire table. I built out a one column calculated table at the end of my post on connecting data sources to power bi. I’m going to expand on that today.

You can add a calculated table by clicking over table tools and then onto add table. This will open up your DAX expression. There are many ways to create a calculated date table. I will talk about three of them.
Bad Calculated Date Table
bad_date_table = CALENDAR(DATE(2023, 01, 01), DATE(2023, 12, 31))
I’m going to break this down. The table name is “bad_date_table”. The DAX expression uses “calendar” which takes two arguments, a start date and an end date in that order. The start date is set by the analyst, in this instance it is 01JAN23 and it is set using the DATE expression with the year, month and day as arguments. Then end date is also set in a similar manner.
What’s wrong with this? It’s not automated. You have to go in a manually change it when the date of your data goes outside of the date range in the date table. When used as part of a data model a date will be used as a filter either on your visual or in DAX measures. No data that is associated with a date outside of this range will be recognized and incorporated in your data model.
Your visuals will not reflect the actual data because data outside the range will be filtered out. Users of the report will be mad. You, as an analyst, will be embarrassed. Whenever I find an old report with the date table made in this manner, I adjust the DAX expression to my “better calculated table” below.
Better Calculated Date Table
Date_Table = (CALENDAR(MIN('table'[date]),MAX('table'[date])))
This is a mirror of a calculated table in Connecting Data Sources to Power BI. Instead of manually setting your date range, you connect it to your fact table. So, the minimum date is the earliest date in the “date” column of “table” and the maximum date is the latest date in the “date” column of “table.” The min and max date don’t have to be from the same table. If you have two fact tables that have different ranges, you can encompass your entire range of dates. Whenever I find a date table created like the “bad” date table, at a minimum I automate the date range by mirroring the “better” calculated date table.
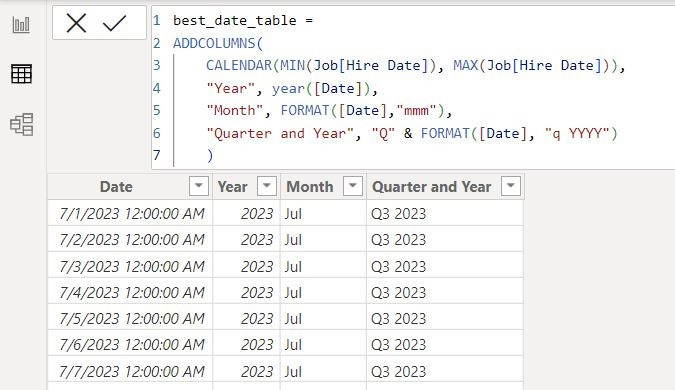
Best Calculated Date Table (Vitamin Butane Level)
The difference between better and best is that best has all the columns you need for time slicing created with a single DAX expression.
best_date_table =
ADDCOLUMNS(
CALENDAR(MIN(Job[Hire Date]), MAX(Job[Hire Date])),
"Year", year([Date]),
"Month", FORMAT([Date],"mmm"),
"Quarter-Year", "Q" & FORMAT([Date], "q YYYY")
)
A date table is a dimension table. There are a ton of potential date/time levels that can be used to filter on the date/time dimension.
This expression doesn’t only create an auto-updating date table. Tt also creates more columns in the date table that can be used to slice and dice your data. Now you can create whatever types of time columns suit your needs. With this particular expression I created a year column which is formatted with the “year” function built on top of “date” which is the original date column from this calculated table. I created two more columns. One with the date formatted as a month and one with the date formatted as quarter and year.
Here is what this looks like:
Types of DAX Functions
DAX functions are the building blocks of DAX formulas. Some examples of DAX functions from the examples in this post are: sum, calendar, min, max, addcolumns, and format.
DAX functions can be separated and classified into types, depending on what they do. Types of functions include:
Math functions (sum, average, min, max)
Stats functions (count, stdev.s)
Text functions (concatenate, left, right, len)
Date/Time functions (today, year, month, day)
Logical Functions (if, and, or, not)
Filter functions (filter, all, calculate)
The Microsoft documentation is a great reference if you want to dig deeper into types of DAX functions and individual DAX functions.
Conclusion
This is a fairly basic overview of DAX. but there’s still a lot to chew on for a new Power BI user. I encourage you to create some measures and calculated columns in your own personal projects and to create a calculated date table with a bunch of date/time columns that can be used to slice and dice your data in different ways. Remember the differences between measures and calculated columns and dive down the DAX rabbit hole as needed. Hopefully this post solves some easy problems and shaves some time off the DAX development process.