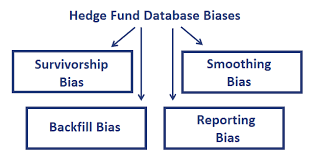
Backfill Bias
Backfilling, Backfill Bias, Quantitative Analytics, Hedge Funds, and some insights into time series analysis.
Table of Contents
Backfill Bias
Hedge Funds
The Hedge Fund Industry
This post is effectively a follow up to the look ahead bias one. This one was created specifically for those that also work as Quants, or have a lot of time series analysis to deal with.
Note: Another common bias you will encounter is the survivorship bias.
1- Backfill Bias
Backfills
In data science, backfill is the process of filling in missing values in a time series dataset. When a time series dataset has missing values, it can be difficult to perform accurate analysis on the data. By filling in the missing values using a method that is consistent with the rest of the data in the dataset, you can improve the accuracy of your analysis.
There are many different methods for filling in missing values in time series data, and each has its own advantages and disadvantages. Some common methods include:
Replacing missing values with the average value for that time period
Replacing missing values with the most recent known value
Filling in missing values using a trend line or other regression model
Backfill bias
This bias is a type of selection bias that can occur in time series analysis when data is sampled sequentially over time. It occurs when earlier values are used to fill in for missing values in later data, which can skew results.
There are a few problems that this bias adds can cause if you are not careful. One common cause is when there is a systematic trend in the dataset, and the missing values are located at points where the trend reverses. This can cause the estimated trend to be biased towards the direction of the original trend.
Another common cause is when there are discontinuities in the dataset, and the missing values are located at or near these discontinuities. This can cause the estimated trend to be biased away from the discontinued original time series.
Potential Damage caused by backfill bias
This bias can be defined as the process of adding new dataset points at the end of an existing dataset. This can often lead to inaccurate results, as the new value points may not be representative of the entire dataset.
In data science, backfill bias adds can often lead to incorrect conclusions being drawn from a dataset. For example, if a data scientist is researching how a certain company's stock prices have changed over time, and they only have access to data from the last five years, they may erroneously conclude that the company's stock price has been steadily increasing during that time frame.
However, if they were able to access data from ten years ago, they would see that the stock price actually fluctuated quite a bit during that time period.
2- Hedge Funds
What are Hedge Funds
Hedge funds are investment vehicles that allow for pooled investment in a variety of assets, usually with a higher degree of risk and potential for greater return than traditional investments.
The name "hedge fund" comes from the use of hedging techniques by early investors in order to minimize losses during times of market turbulence.
Hedge funds are not regulated in the same way as mutual funds or other securities, and they are not required to disclose their holdings or investment strategies. As a result, they can be difficult to assess or value and may present greater risks to investors than more traditional investments.
Why do people use hedge funds
There are many reasons why people use hedge funds. Some people use them to protect their wealth during tough economic times, while others use them as a way to grow their money.
Hedge funds are often used by investors who have a long-term outlook and are looking for ways to protect and grow their wealth. Many hedge fund managers have a lot of experience and expertise in investment markets, which can help provide peace of mind to investors.
During difficult economic times, hedge funds can also provide stability and security. Many hedge funds take a more conservative approach to investing, which can help protect your assets during market downturns.
3- The Hedge Fund Industry
Fundamental Analysis
Fundamental analysis is the process of analyzing a company's financial statements and indicators to determine its intrinsic value. This value is then used to make investment decisions about whether to buy, sell, or hold the stock.
There are many different factors that can be considered in fundamental analysis, but some of the most important ones are a company's earnings, revenue, profitability, and growth potential. savvy investors will also pay close attention to a company's debt levels and insider ownership.
Insider ownership is a good indicator of how well management knows the business and how committed they are to growing shareholder value. Another useful metric that fund managers are using nowadays is studying the flows of other hedge funds, and looking at their cumulative returns generated, and running some weighted score based off of flows.
Technical Analysis
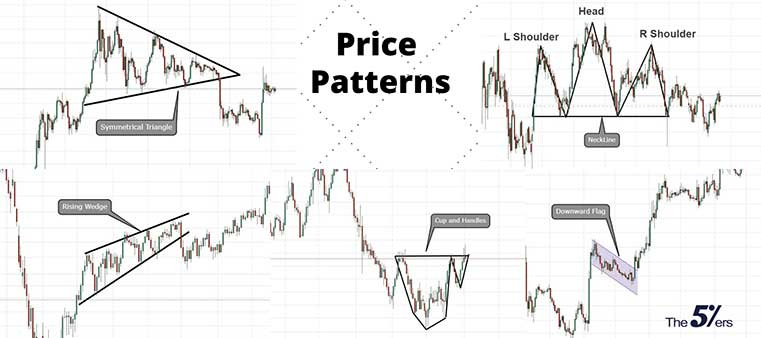
Technical analysis is a method of analyzing stocks and other securities by studying the charts of price movements and patterns. Technical analysts believe that these charts contain all the information investors need to make informed decisions.
The basic premise of technical analysis is that prices move in trends, and that past prices can be used to predict future prices. By identifying chart patterns and indicators, technicians believe they can determine when a security is over-bought or over-sold, identify entry and exit points, and forecast price movements.
If you were there when the crypto bubble popped in early 2022, then you've had a first hand view to see some horrible technical analysis. But, generally speaking, for price prediction, you can use momentum based factors to start to bring the standard deviation (risk) associated with ML models down a bit.
Quantitative Analysis
Quant Analysis
Quantitative Analysis is a form of analysis that uses numerical and mathematical formulas to make objective decisions about a security or investment. It relies on statistics and probability theory to examine past events and trends in order to identify patterns that can be used to predict future movements in the price of a security or the overall market.
Quantitative analysts use computers to crunch analysis and run complex calculations, which allows them to identify opportunities and risks that might not be apparent through traditional research methods.
By using quantitative analysis, investors can develop a more comprehensive understanding of how individual securities and the markets as a whole are likely to behave under different conditions. This information can then be used to make more informed investment decisions.
Data Science
Let's be real for about two minutes. Any dude on YT claiming you can build a trading bot is lying to you. They want to sell you a get rich quick course, and then run away with your money.
There are some real genuine ways that Quants use Data Science principle to analyze stocks. Here are a few common ways that work: You can use NLP (Natural Language Processing) models in order to see what the consumer sentiment regarding certain companies is, and then you quickly adjust the weightage on your portfolio based off of this metric, as it gives you an idea on what the company's bottom line will look like 2/3 years later.
Another one is to use methods like learning to rank (rank-pairwise) in order to do some portfolio optimizations instead of sticking with just classical vs regression problems.


