Kernel Regression
Understanding & Using Kernel Regression in R & Python. Examining topics such as weighted average, kernel estimation, kernel density function, and common functions like gaussian kernel function.
If we have some sort of complex non linear data, how would we figure out how to make the regression curve of best fit? We've seen that the quadratic regression although technically works, generally isn't a good idea from the p-value analysis. To deal with this potential problem, there is a solution called Kernel Regression.
You can view the code for this post here.
Table of Contents
Frequently Asked Questions
Perform kernel regression
Non Parametric Regression vs Parametric Regression
Estimating regression
Common Kernel Functions
Frequently Asked Questions
What is kernel regression?
Kernel regression is a technique for non-parametric estimation of regression models. Unlike linear regression, which estimates a single constant coefficient for each predictor variable, kernel regression estimates a smooth function of the predictor variables. This makes it well suited for data sets where the underlying relationship between the dependent and independent variables is non-linear.Kernel regression has a number of advantages over other non-parametric methods such as splines. First, it can be used to estimate conditional expectations without making any distributional assumptions about the data. Second, it can easily be applied to high-dimensional data sets (i.e., data sets with many predictor variables)
What is kernel regression used for?
Kernel regression is a non-parametric technique used for estimating the unknown function of a random variable. The main advantage of kernel regression over other methods is its flexibility, which allows it to adapt to a wide range of situations. Another advantage is that it can be easily computed even when the data are high-dimensional.Kernel regression has a wide range of applications, including curve fitting, prediction, classification, and density estimation. It is also well-suited for data with discontinuities or nonlinear structure. In general, any situation where you need to estimate an unknown function from data can benefit from using kernel regression.
What is the non-parametric regression technique?
A non parametric regression technique is a statistical method that doesn't make any assumptions about the data's underlying distribution. This makes it more flexible than other methods, but also more difficult to interpret the results.Kernel regression is a type of non parametric regression that's particularly well-suited for estimating relationships between variables when there's a lot of data. It works by using a kernel, which is a function that determines how similar two points are, to estimate the values of a unknown point based on the values of nearby points.
Non parametric methods are often more accurate than parametric methods (which do make assumptions about the data), but they can be harder to work with
What is the kernel function in regression?
Kernel function is a mathematical function that helps in smoothly mapping the data points in higher dimensional space. It is used in many machine learning algorithms and is an important part of kernel regression.The kernel function defines a similarity measure between every pair of data points. This similarity measure is used to create a weighting for each data point, so that the data points are closer together in the higher dimensional space are given more importance than those that are further apart. This helps to reduce the number of parameters that need to be estimated in the regression model, and results in a more accurate prediction.
What is the gaussian kernel regression?
A Gaussian kernel regression is a type of non-linear regression that uses a Gaussian kernel to fit the data. The advantage of using a Gaussian kernel is that it is less sensitive to outliers than other types of regressions. This makes it ideal for data that may have extensive noise or be highly non-linear. The downside to using a Gaussian kernel is that it can be slower to train and predict than other types of regressions.Gaussian kernel regressions are often used in machine learning applications where the data is spread out or has many outliers.
Perform Kernel regression
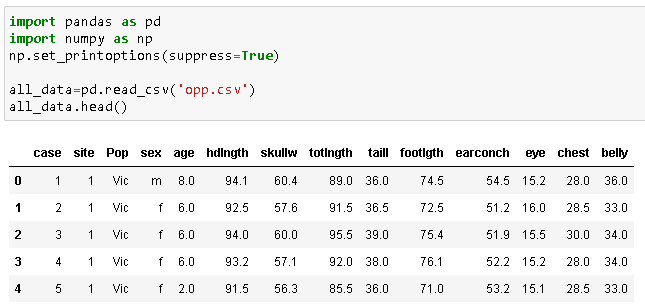
For this example, we will use a bunch of data related to an oppossum's age, and use try to use kernel regression in order to predict it's age. We will do this in both R, and Python, as I continue to hammer down on the importance of learning both R & Python for your data science career.
R
Loading our Data Set
Let's go load up our data set for this example. In order to load up the data, we will use the data.table library. From this library, we will use the fread() function for loading up our data. We will use this because this function is much faster than the classic read.csv(), and generally it's good practice to use this one instead.
Setting Up the Data Point
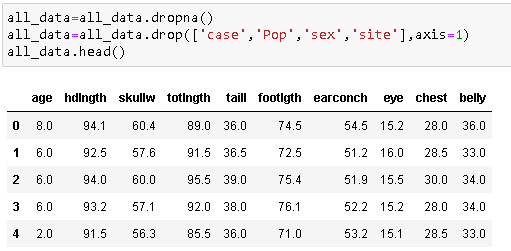
We will go ahead and keep life simple by just tossing away all of the categorical and ordinal data. From this post, you can see there is value in keeping them, but for this example, we'll just keep life simple.
Split The Training Data (training set) & Validation Data
You can click here to learn more about the training and validation data. But, basically in data science, you want to keep the stuff your model is learning from separate from what you want it to predict. To keep it simple, we'll just do a simple 50-50 split. Meaning, we will use 52 observations for our training point, and the other 52 for our validation point.
Implementing the kernels & Prediction Time
To do the vector regression, we will use the npreg() function from the np library. This is because a lot of what we are looking for is already available here. That is someone has already done all of the work we need, and all we have to do is just implement the bandwidth that we are after. We'll start off by running the gaussian kernel for this example.
Now, let's use the above for a prediction, and then look at the actuals vs the predicted side by side in the following table.
Python
Loading our Data Set
We will use the read_csv() function from the pandas library to load up our data set and get it ready for this example.
Setting Up the Data Point
We will go ahead and keep life simple by just tossing away all of the categorical and ordinal data. From this post, you can see there is value in keeping them, but for this example, we'll just keep life simple.
Split The Training Data & Validation Data
You can click here to learn more about the training and validation data. But, basically in data science, you want to keep the stuff your model is learning from separate from what you want it to predict. To keep it simple, we'll just do a simple 50-50 split. Meaning, we will use 52 observations for our training points, and the other 52 for our validation points.
Implementing the kernels & prediction
Now, we will use the KernelReg() function from the statsmodel library. To keep things simple, I'll just use the default values. The idea is to separate each of the columns into their own separate vector values, and then get them ready to do a simple vector regression.
Now, we'll toss this into the test x columns for the predictions, and let's take a look at the predicted values alongside the real original values.
Keep in mind that we have different answers for the above R and Python scripts because I did not specify any of the parameters, just went with the original defaults.
Nonparametric regression vs parametric regression
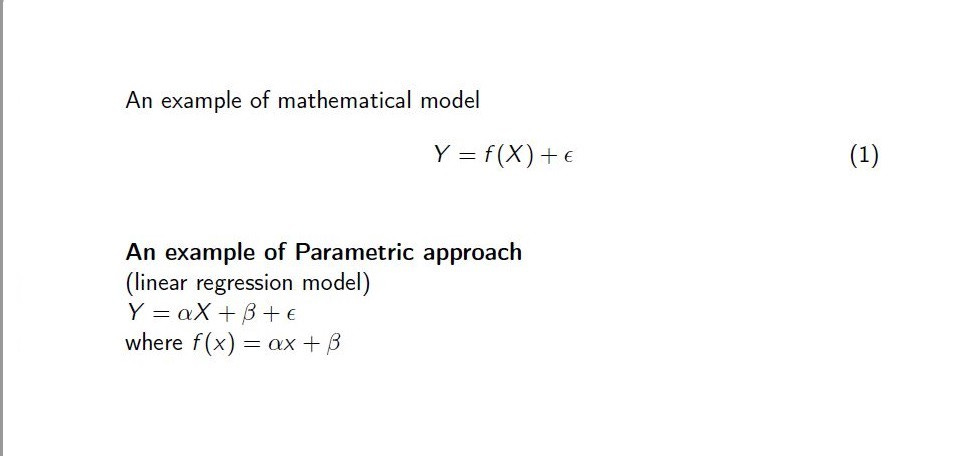
Parametric Regression
Parametric regression is a technique used in statistics to estimate the relationship between one or more independent variables and a dependent variable. It is a form of linear regression, which is a type of statistical modelling that allows us to determine how one or more independent variables are associated with a particular outcome (dependent) variable.
Parametric regression makes certain assumptions about the underlying data-generating process, including that it is linear and that the residuals (errors) are normally distributed. If these assumptions are not met, then parametric regression may not be appropriate and another type of regression, such as nonparametric regression, should be used instead.
Non Parametric Regression
Non parametric regression is a statistical technique that is used to model data that does not have a clear linear relationship. This method is often used when the relationship between the dependent and independent variables is non-linear, or when the dependent variable is categorical.
Non parametric regression does not make any assumptions about the functional form of the relationship between the variables, and so it can flexibly adapt to any kind of data. This makes it a powerful tool for data analysis. However, non parametric methods are generally less efficient than parametric methods, and so they may not be suitable for large datasets. Here's a simple table that lists the pros and cons of parametric vs non parametric regression.
linear combination
A linear combination is a way of combining multiple variables to produce a new variable. This can be done by adding or multiplying the values of the individual variables, or by taking a weighted average. Kernel regression is a type of regression analysis that uses a kernel function to calculate the weights.
This approach is often used when there are too many data points to fit into a traditional linear model. By using a kernel function, the kernel regression can "learn" the nonlinear relationships between the input and output variables. Click here for more details on linear combinations.
or, if you wanted to apply this concept to exponentially distributed data, go here.
You can think of the kernel function as a simple weighting function since this function tells us what the weights should be. There are many different weighting function you can use, a simple list of them is below.
Estimating regression
Smoothing parameter (bandwidth)
The smoothing parameter is a parameter that determines how smoothly the function will be fit to the data in this higher-dimensional space. A smoothing parameter is sometimes called a bandwidth. It's important for choosing an appropriate bandwidth because it can affect the precision of the estimated coefficients as well as how accurately the function fits the data.
A high bandwidth will give you a very smooth curve, while a low bandwidth will give you a more jagged curve. The choice of bandwidth is important because it affects how well the data fits the curve and how accurately the predictions from the curve match the actual data points. Below is an example of some data points which have low vs high kernel smoothing.
Kernel estimation (kernel density estimation)
Kernel density estimation is a technique used to estimate the shape of a probability distribution by constructing a smooth curve through a set of points. This curve can then be used to approximate the underlying distribution function.
The kernel density estimation is used to calculate the values of the kernel function at each point in the input data. This gives a measure of how dense the data is at each point, and can be used to improve the accuracy of the predictions made by kernel regression.
The advantage of kernel estimation over histograms is that it allows for the estimation of the shape of the distribution, even when there are few data points.
Gradient descent
Gradient descent is a popular optimization algorithm. It takes a vector of parameter values, and finds the locally minimum values of an objective function (e.g., loss function) by iteratively moving in the direction of the negative gradient of the objective function, at every step halving the size of the step taken.
Remember, since kernel regression is a technique used for estimating the relationship between two variables. It works by fitting a kernel function (a mathematical curve) to a set of data points. The idea is that you can use something like gradient descent, in order to figure out where in the function can we go to, in order to minimize the loss function (error function).
Gradient Descent is just one technique out of many that is used for solving objective functions. Here is a solid video to understand this technique better. We will come back to it at a future point.
Kernel Function
Gaussian kernel
The gaussian kernel is a mathematical function that takes a point in feature space (X), and returns a value that represents the probability of Y being at that point. The larger the value returned by the gaussian kernel, the more likely it is that Y is found at that point. This makes the gaussian kernel perfect for use in kernel regression, as it allows us to find the relationship between X and Y while taking into account nonlinearities in the data.
The gaussian kernel is used in kernel regression because it provides a good fit for data that follows a normal distribution. The gaussian kernel can be thought of as a "weighted" average of the values in the dataset, where the weights are determined by the distance of each point from the center of the dataset. This makes the gaussian kernel well-suited for datasets with outliers or noise.
The gaussian kernel is one of the most commonly used kernels for kernel regression, because it has desirable properties such as smoothness and symmetry. It is also easy to compute, which makes it suitable for use on large datasets. Below is a simple image of the formula for the gaussian kernel that you can use for your data point. As stated earlier, you will not need to know it, but for some of the mathematically inclined readers, here is the formula.
Nadaraya – Watson estimator kernel
The Watson estimator is a particular type of kernel function that has been found to be particularly effective for data with high-dimensional features (e.g. images). The Watson estimator has been shown to provide superior performance than other functions when used in kernel regression. The Watson function is particularly well-suited for problems where the predictor variables are highly correlated.
Below is the following equation for it, you do not need to memorize it, but it's here for those who are curious.
Priestley – Chao estimator kernel
The Priestley kernel is an important tool for kernel regression, which is a technique used to estimate the function of a random variable from a set of data points. The Priestley kernel allows for efficient computation of the regression estimator, and has a number of desirable properties that make it advantageous over other kernels.
One key advantage of the Priestley kernel is that it is translation invariant. This means that the estimates produced by the regression will be unchanged if the data points are shifted by any constant amount. This is especially important in applications where data may be subject to measurement error or other sources of imprecision, as it ensures that these errors will not affect the results of the analysis.
Below is the following equation for the Priestley - Chao function
Gasser – Müller estimator kernel
The Gasser kernel is considered to be more efficient than other types of kernel functions. It has been shown to be more accurate when predicting outcomes for data sets with a high degree of variance. Additionally, the Gasser kernel can handle non-linear relationships between input data points better than other kernel functions. This makes it a popular choice for use in machine learning applications.
The Gasser kernel has the following properties, such as being smooth and having low noise levels. Below is the formula for the kernel.


This is basically automating what we did manually in the polynomial regression (https://bowtiedraptor.substack.com/p/feature-engineering-part-2-polynomial)?
C Hi added Morgan Rose to the group.